DASHBOARD
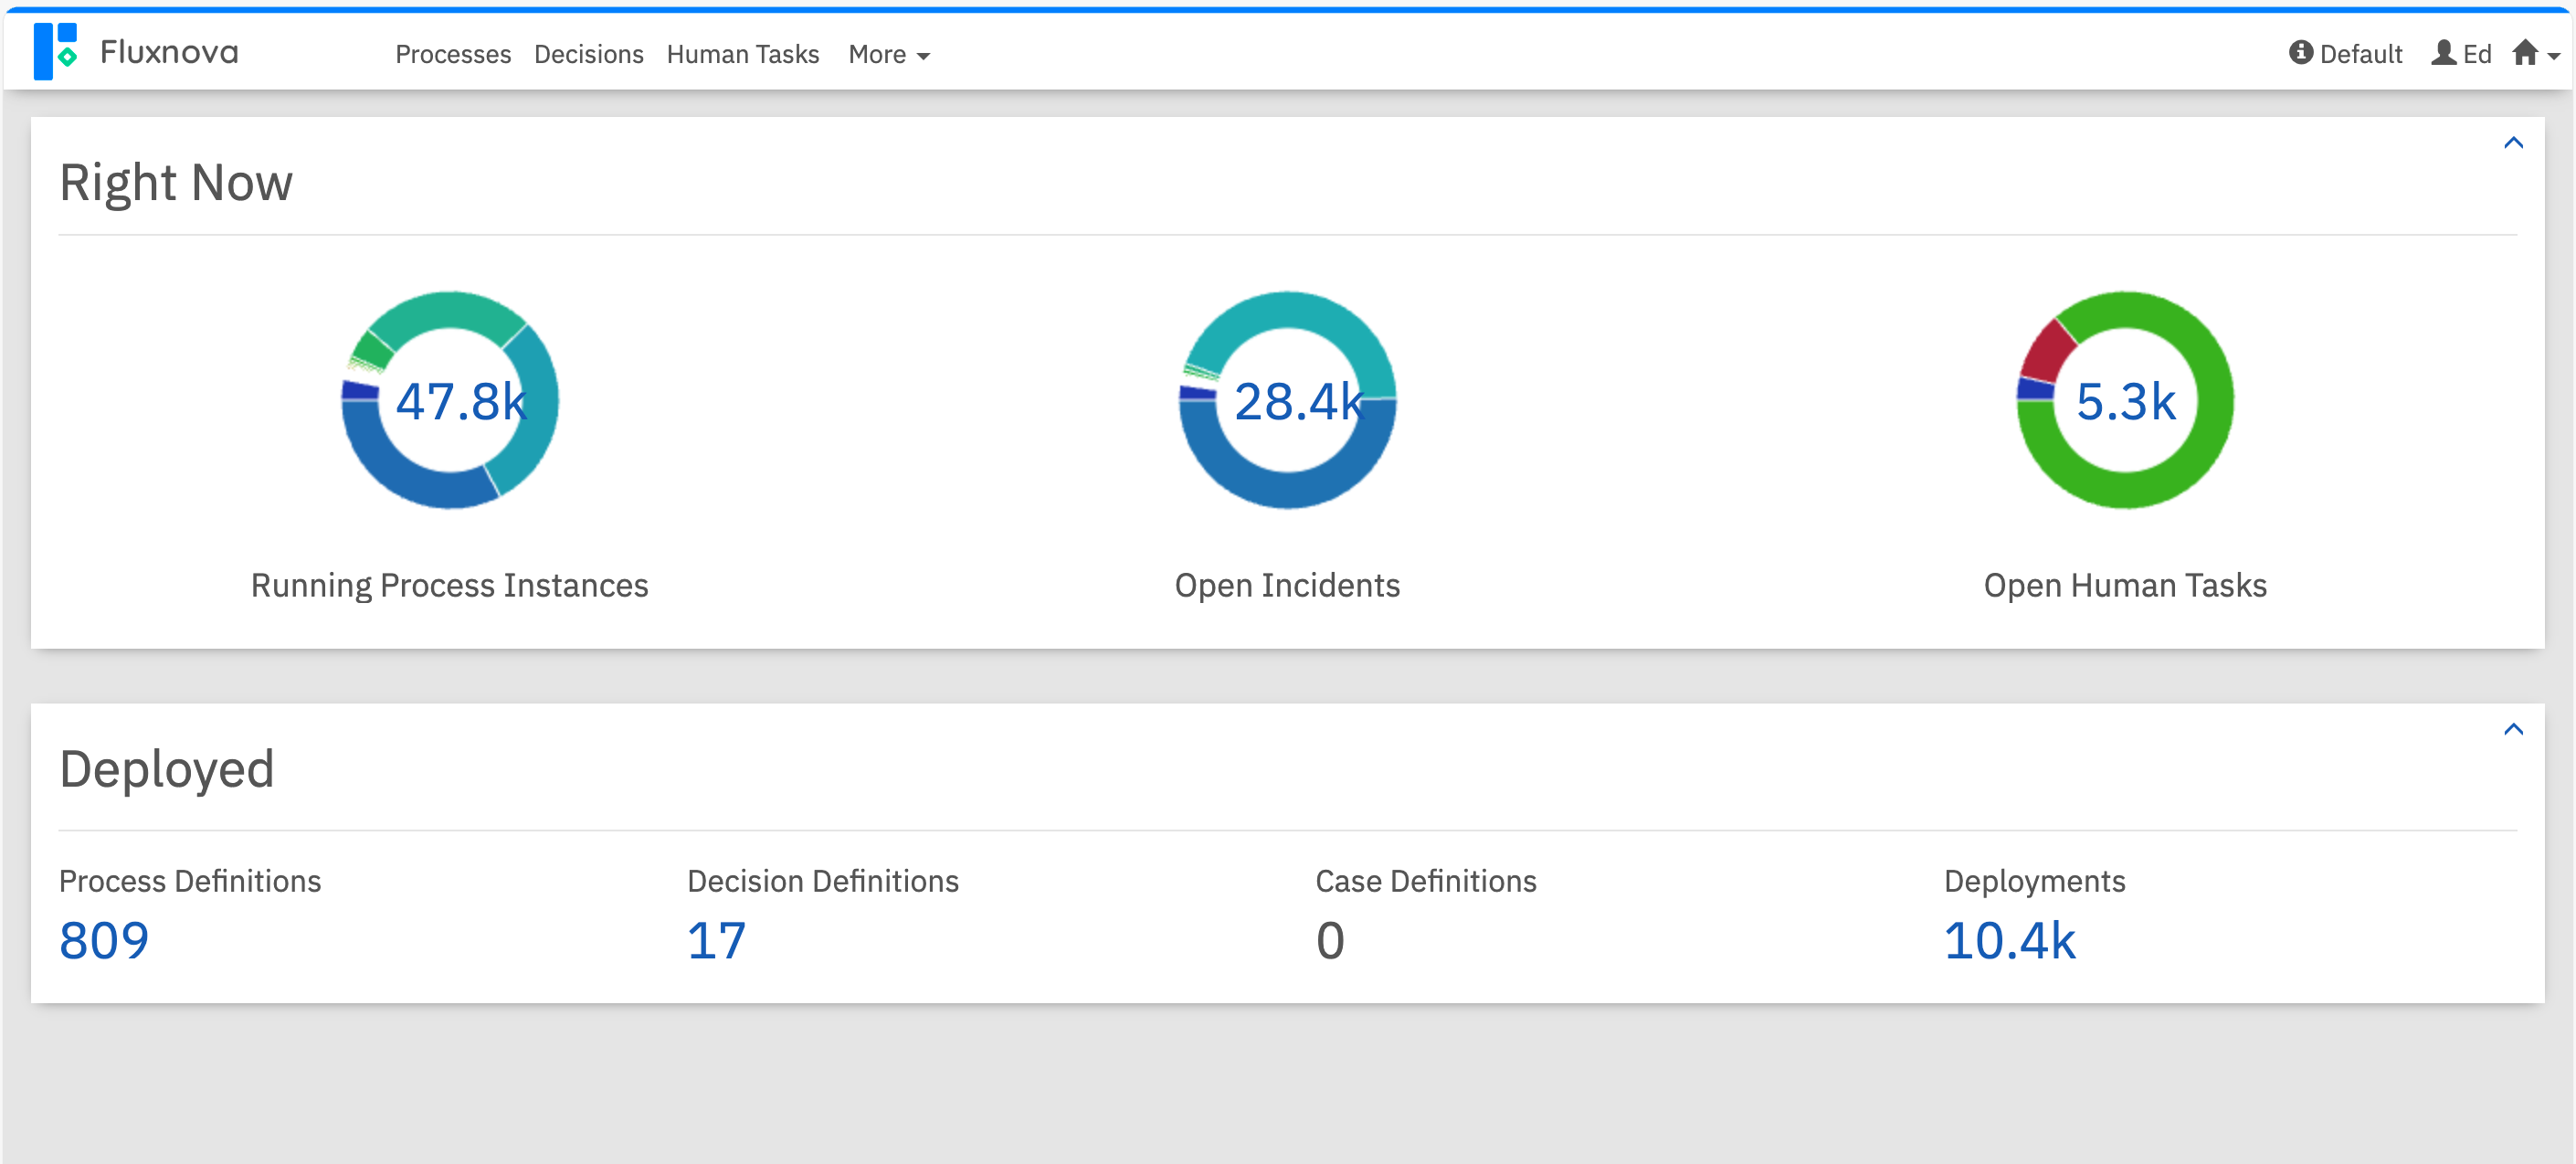
Need Answers Fast? Just Click the Chart.
Our intuitive dashboards show you what’s happening across your operations—instantly. From incident counts to running process instances, explore the data visually and jump straight to the details with one click.
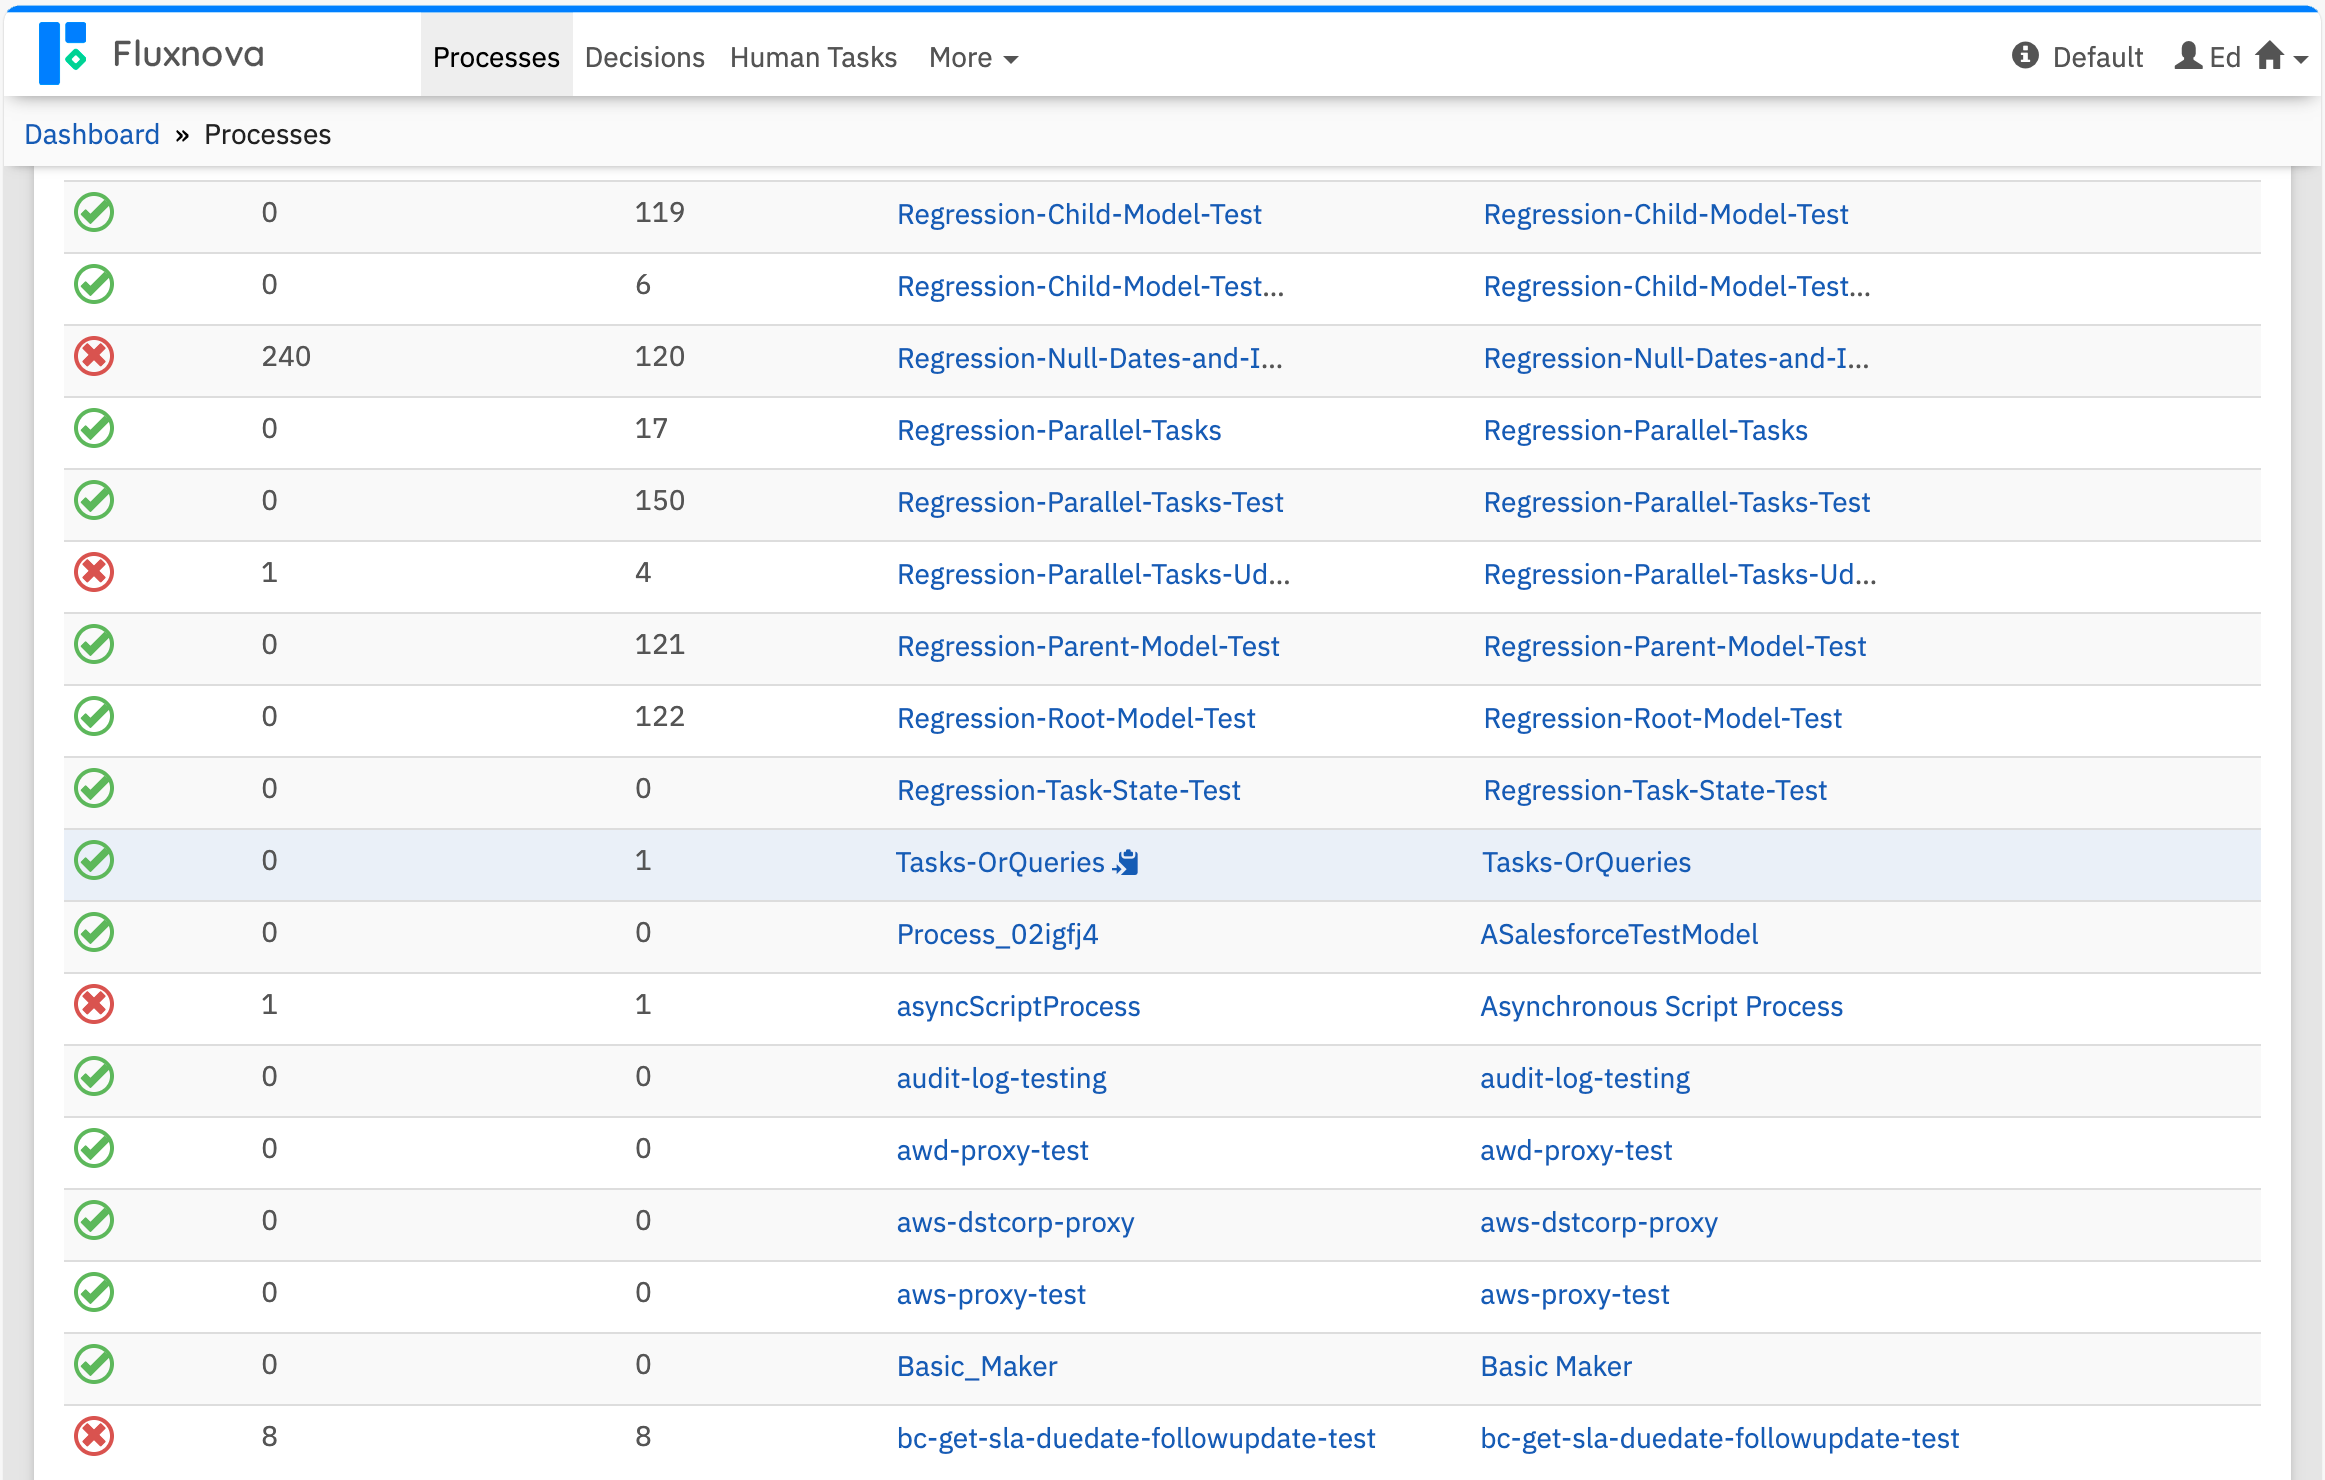
LISTS
Segmented Views
Fluxnova's list pages give you quick access to essential data--organized by:
- Process Definitions
- Batches
- Deployments
- Decision Definitions
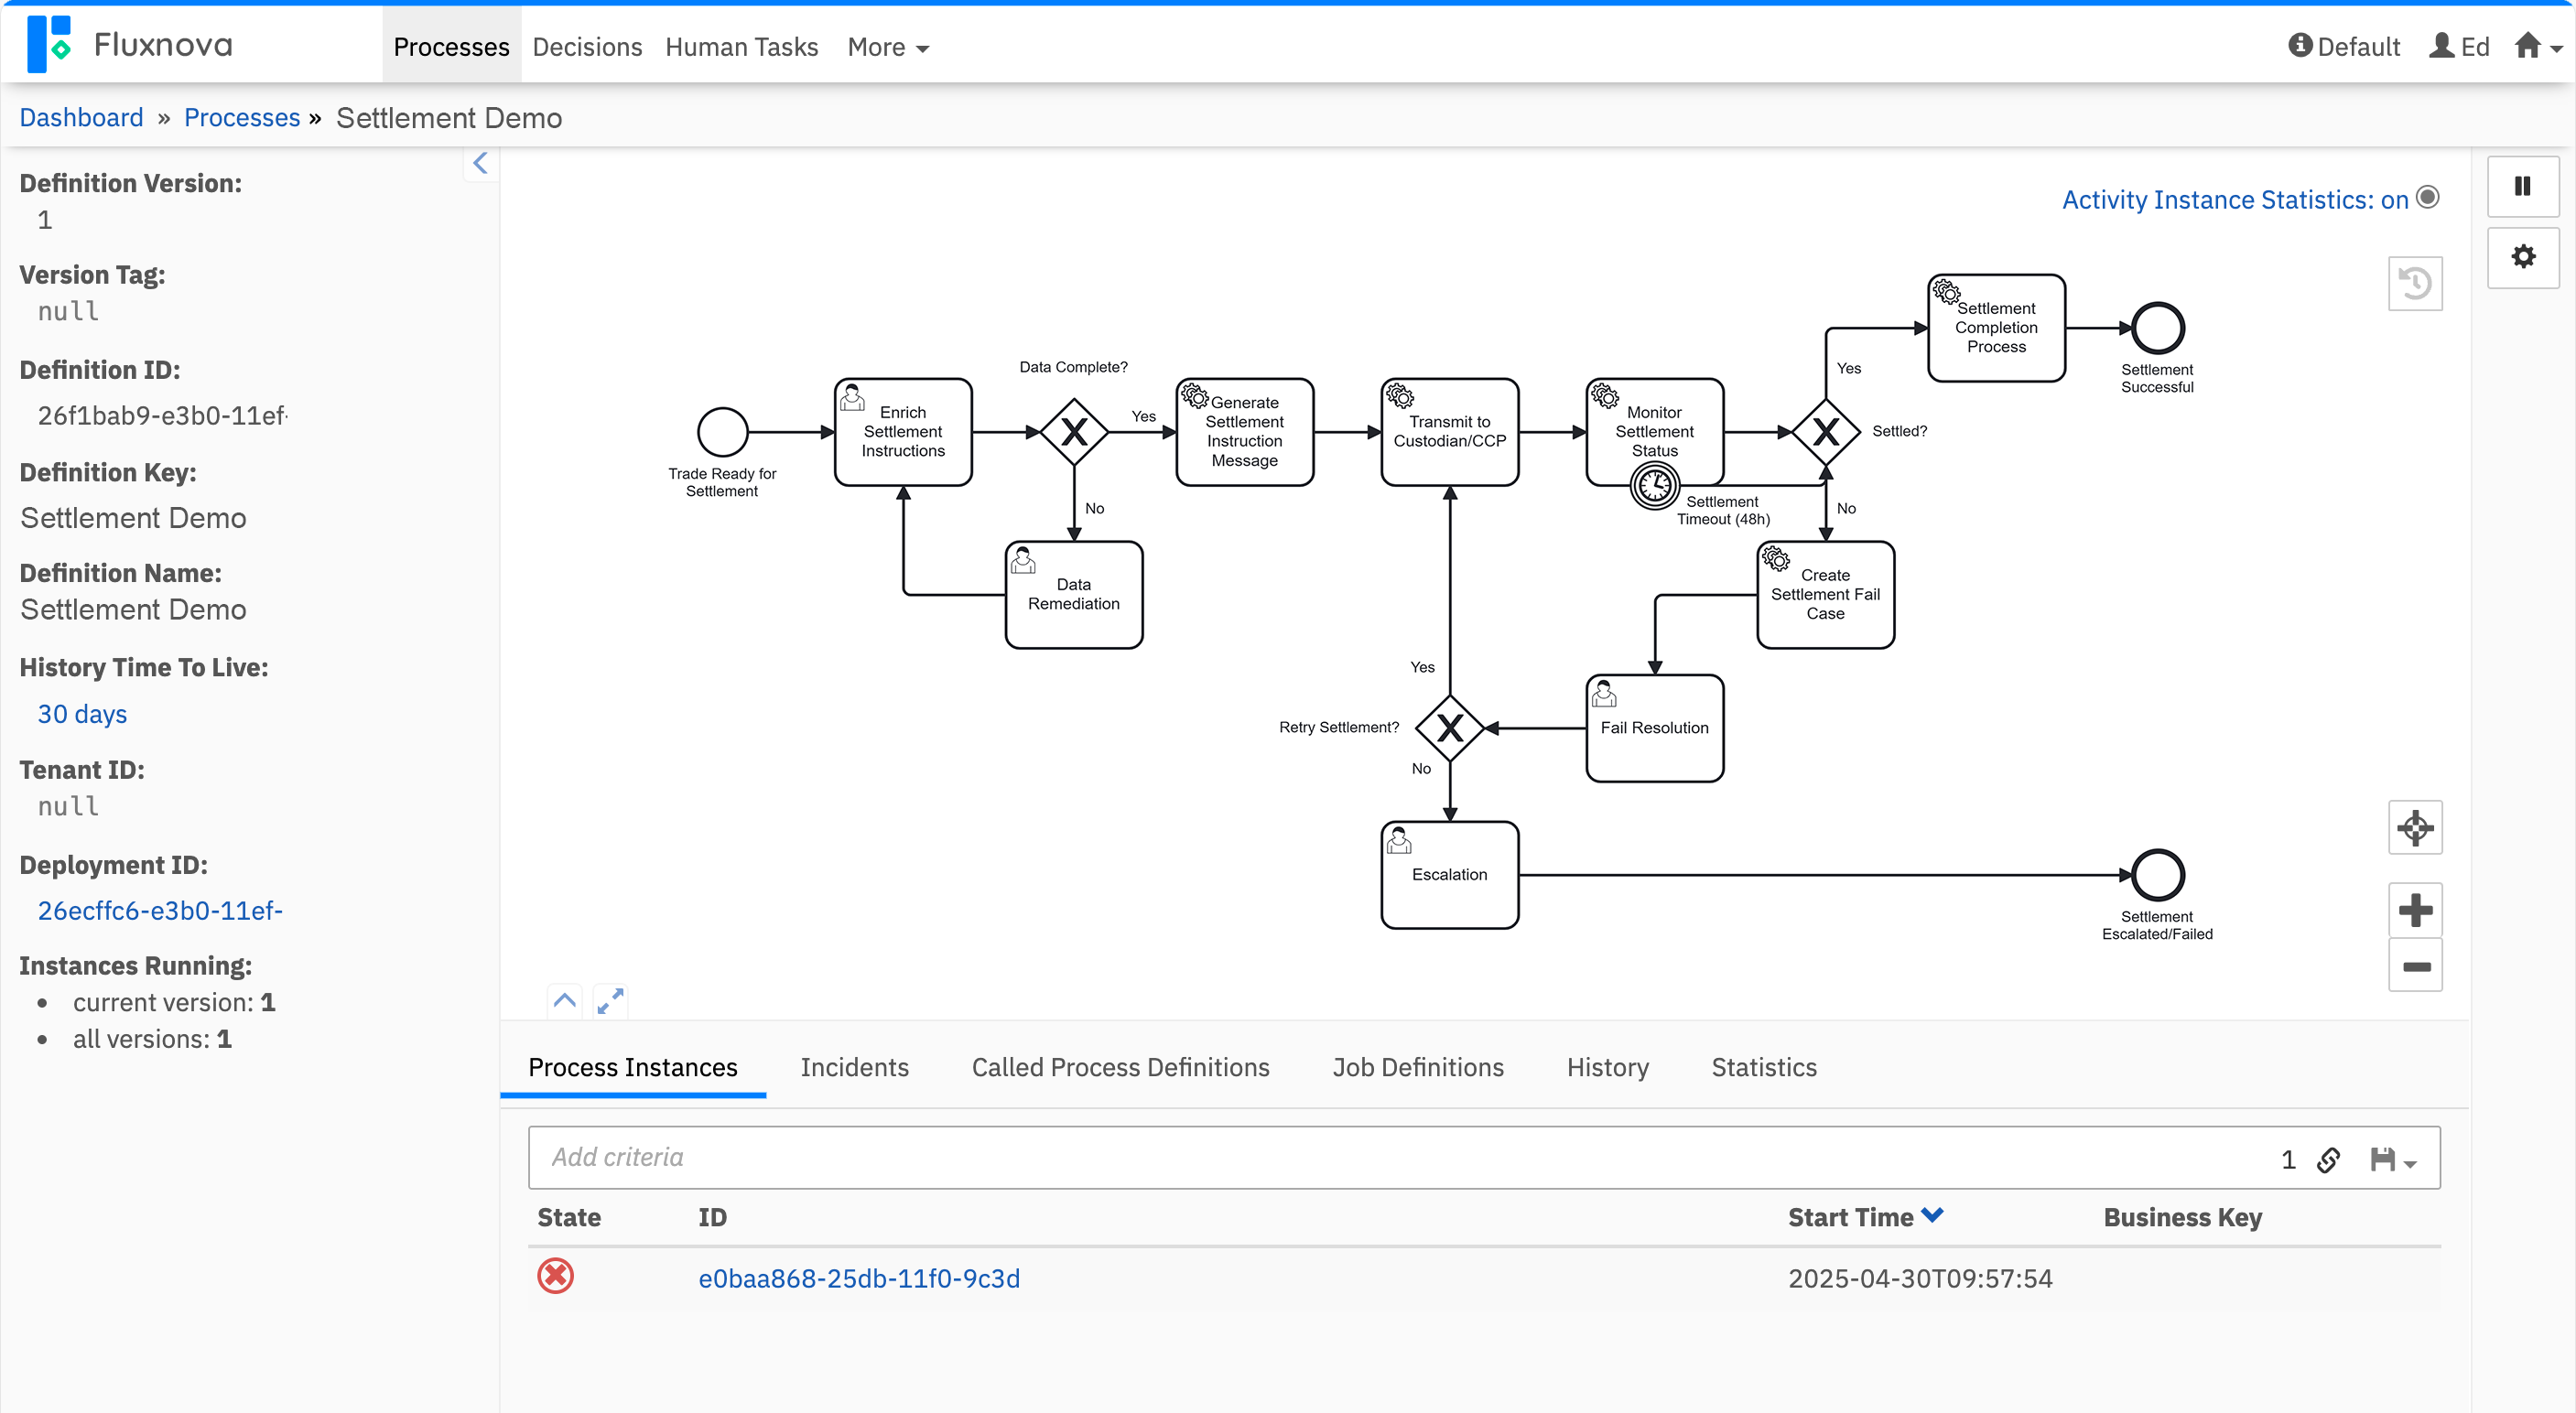
INSIGHTS
Smarter Monitoring Starts Here
Fluxnova Monitoring gives you the power to both analyze and resolve process issues. Identify bottlenecks and incidents at a glance with intuitive process model overlays. Fix issues on the fly and apply the latest improvements—no downtime required.